About Bitly
Bitly is a leading global SaaS company offering a comprehensive platform designed to enable every piece of information shared online to connect with key audiences and ignite action.
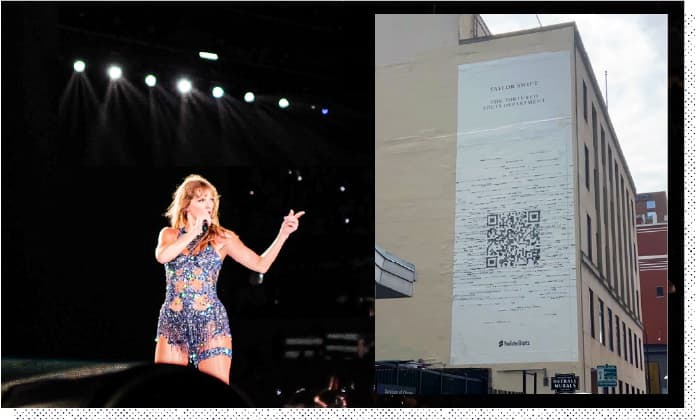
Get inspired and learn how you can captivate your own audience with Bitly QR Codes like Taylor Swift.
Learn how Snapchat for business can be an excellent ally for more engagement.
Elevate your brand with impactful paid social media.
Transform communication with effective SMS for business.
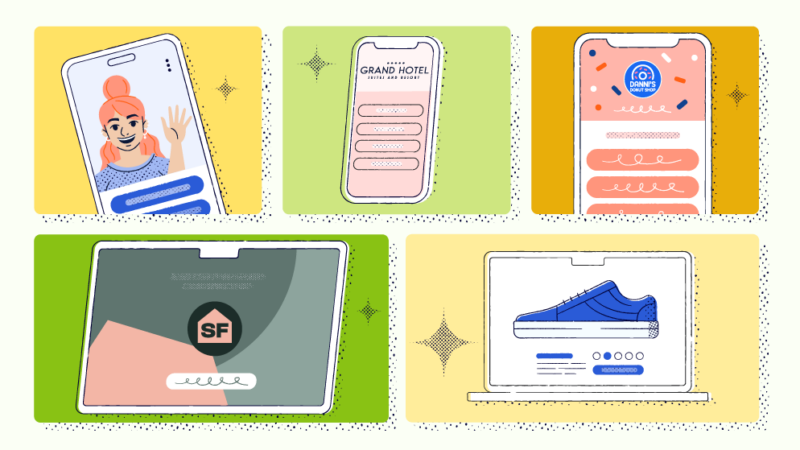
See how microsites can elevate your brand's targeted campaigns.

Learn how to boost your brand with effective Snapchat marketing!
Learn about how you can set up and achieve your social media goals.

Unlock the power of listening online with social media monitoring.

Check out the most essential social media platforms to know for your target audience.
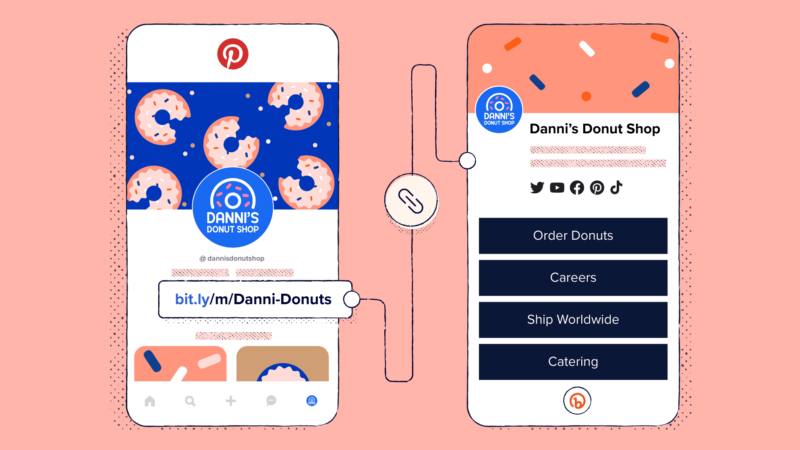
Perfect your Pinterest bio with our ideas and tips here.
Elevate your brand on Instagram with top tips for businesses.
Thanks for confirming your email.